As wildfires and wildfire smoke increase across the United States, symptoms of wildfire smoke exposure are of increasing public health concern. How can technology make a difference?
Author: Joe Skopek, Senior Consultant
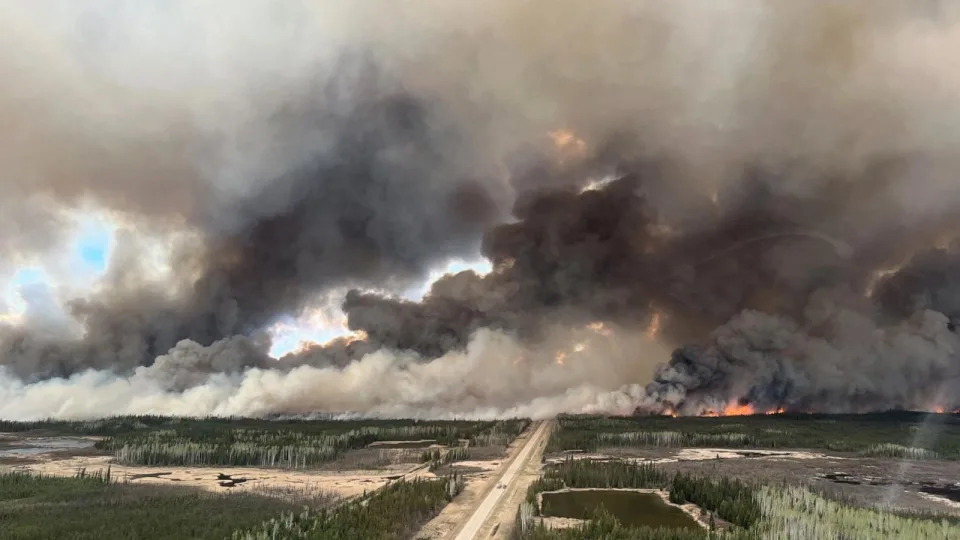
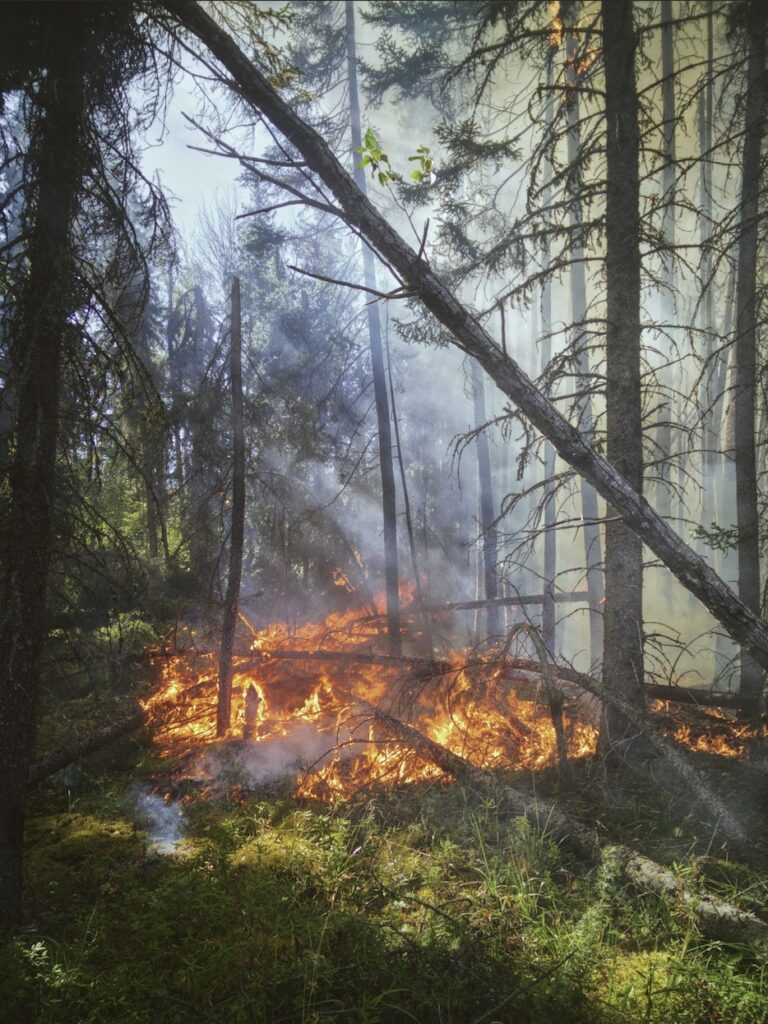
In May of 2024, with over 100 active wildfires burning in Canada, wildfire smoke drifted across the border into the United States, prompting officials to issue the state’s first air quality alert of the year. Several of the string of Canadian wildfires have been labeled “out of control,” according to officials, who placed 40 out of the 140 active fires in this category.
In the U.S., wildfire smoke reached states from Montana to Wisconsin but was especially heavy in Minnesota. The Air Quality Index (AQI) for much of northern Minnesota has been between 150 and 200, which is “unhealthy” and at times went above the 200 AQI mark, into a “very unhealthy” zone.
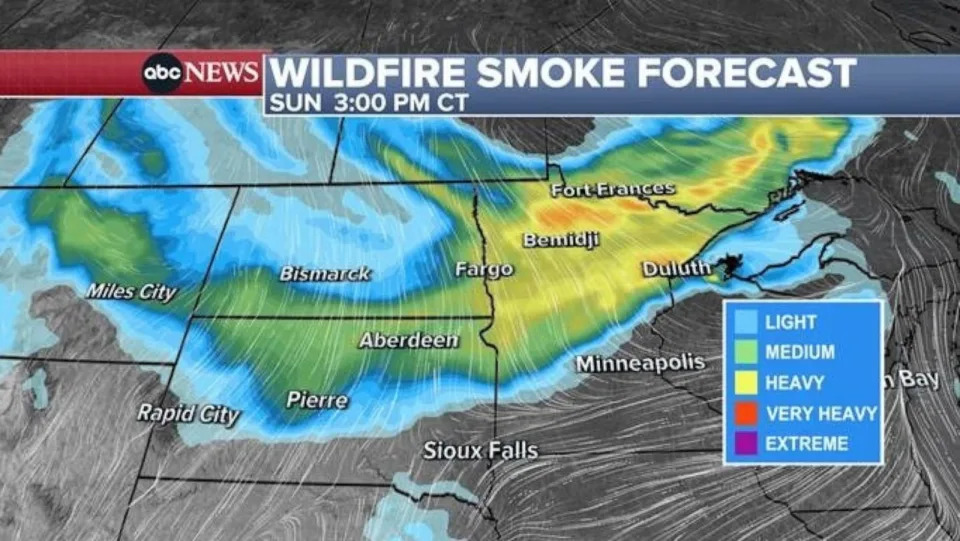
Bemidji, a city in northern Minnesota, recorded a 212 AQI on Sunday, where residents could smell the smoke in the air at these levels and placed the town among the worst air quality locations in the world.
In June of 2023 wildfire smoke from Canada reached the East Coast including midtown Manhattan N.Y. giving the entire city a look of a martian landscape. The city reached an AQI of 342, a level considered “hazardous” for all residents. The Federal Aviation Administration on Wednesday halted some flights bound for New York’s LaGuardia Airport due to the smoke.

The New York State Department of Health published a study in the CDC’s Morbidity and Mortality Weekly Report on the increase in asthma attacks requiring emergency care during the initial wildfire smoke event that occurred in the state due to the Eastern Canadian Wildfires.
The study, “Notes from the Field: Asthma-Associated Emergency Department Visits during a Wildfire Smoke Event – New York, June 2023,” is the first state study of its kind for this event and found that asthma-related emergency department (ED) visits markedly increased June 7, 2023 when air quality reached its poorest levels.
While innovation is the buzzword of the day there is a strong case to be made for a well-managed foundational piece of software.
In a continuously changing technological landscape, the term “innovation” often takes center stage, capturing attention with its promise of cutting-edge advancements and new possibilities. However, amidst the excitement over the latest breakthroughs, it’s crucial not to overlook the importance of a well-managed foundational piece of software. Such a robust foundation is essential for ensuring stability, reliability, and long-term success, even as new technologies emerge and evolve.
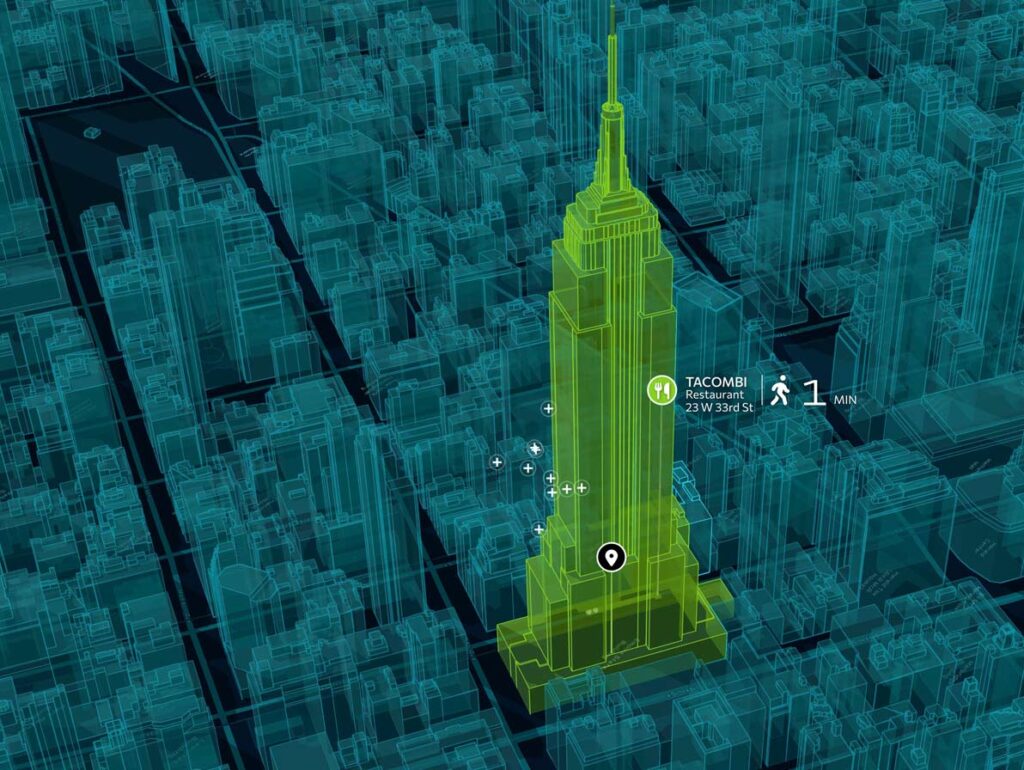
Geographic Information Systems ( GIS) have been around for decades. The term GIS describes any information system that integrates, stores, edits, analyzes, shares and displays geographic information for informing decision making. Typically used by local governmental agencies they tend to be a mystery to the general public and often require specialized training and knowledge that creates a barrier to entry. More recently, that concept is changing. Armed with a smart phone the average user can gain the same insight that the agencies have, allowing them, their families and communities to be better prepared to adapt to a changing climate.
Monitoring Tools build an anticipatory response.
In the face of increasing wildfire threats, monitoring tools have become essential for developing an anticipatory response plan. These tools provide real-time data and predictive analytics, enabling communities and organizations to anticipate potential wildfire risks and act proactively. By integrating such monitoring systems, it’s possible to enhance preparedness, streamline response efforts, and ultimately reduce the impact of wildfires.
Digital tools available for monitoring and mapping conditions include; the US Wildfires Live Feed, the AirNow Fire and Smoke Map, and the National Weather Service (NWS) Smoke Forecast.

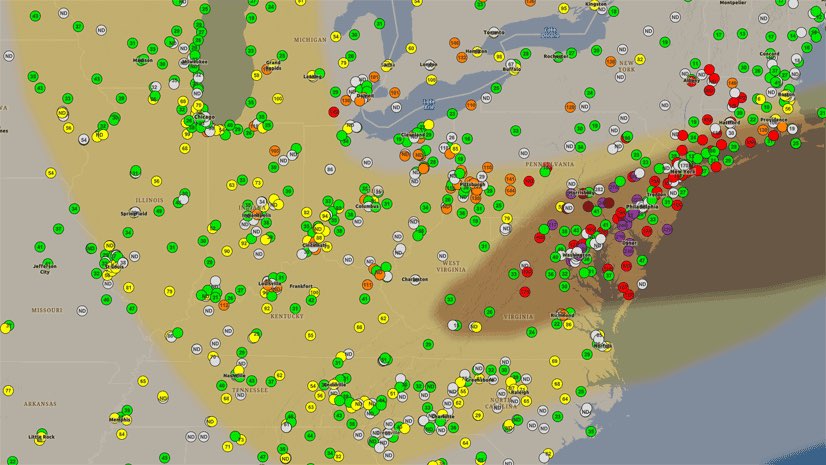
The AirNow Fire and Smoke Map
The AirNow Fire and Smoke Map is a valuable tool designed to aid individuals and communities in safeguarding their health amidst wildfire smoke. It offers a comprehensive overview including:
- Current Air Quality Data: Users can access real-time information on particle pollution levels specific to their location, enabling informed decision-making regarding outdoor activities and exposure to smoke.
- Fire Location and Smoke Plume Tracking: The map displays the locations of active wildfires along with the direction and extent of smoke plumes, facilitating awareness of potential health risks and areas to avoid.
- Smoke Forecast Outlooks: Where available, users can access forecasts predicting the movement and intensity of smoke over time, assisting in planning and preparation for smoke exposure.
- Health Protection Recommendations: Developed by EPA experts in air quality and health, the map provides actionable recommendations tailored to mitigate the health impacts of smoke exposure, empowering individuals to take proactive measures for their well-being.
This collaborative initiative is led by the U.S. Forest Service (USFS)-led Interagency Wildland Fire Air Quality Response Program in conjunction with the U.S. Environmental Protection Agency (EPA), emphasizing a concerted effort between government agencies to provide accessible and reliable information to the public during wildfire events.
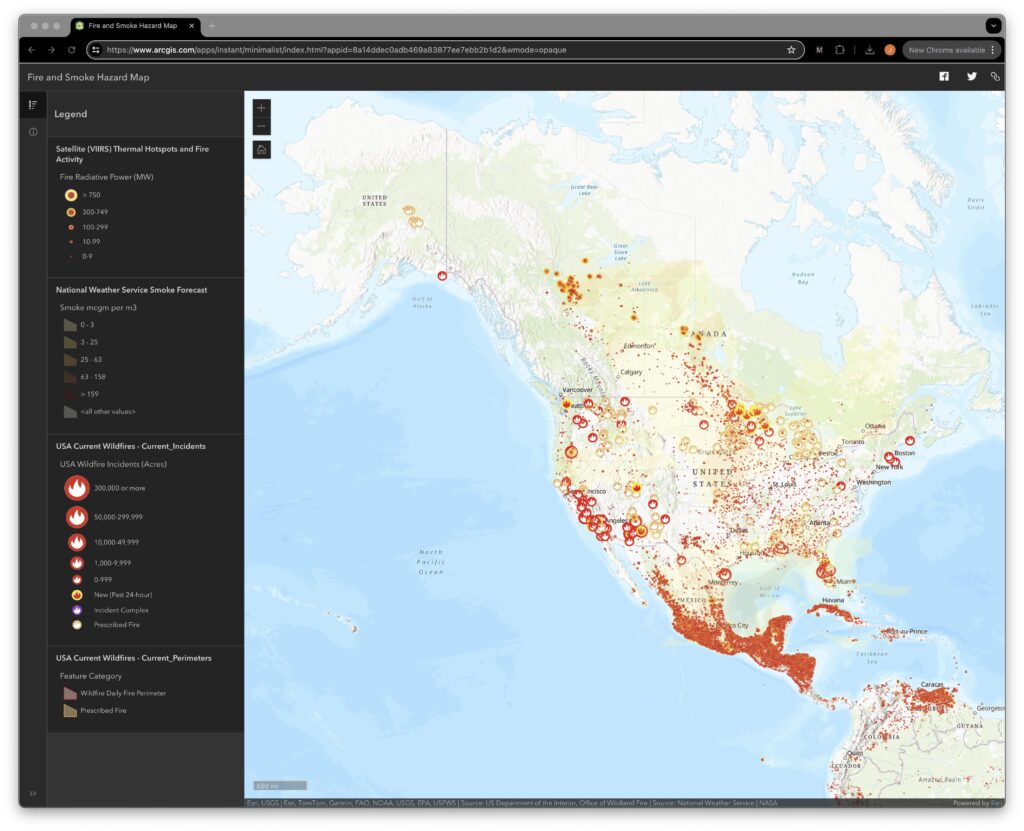
The US Wildfires Live Feed
The US Wildfires Live Feed is a real-time stream of information that provides updates on wildfire incidents and activities across the United States. This live feed aggregates data from various sources, including government agencies, firefighting organizations, and satellite observations, to offer a comprehensive view of wildfire events as they unfold. Additionally, the feed integrates weather data to inform users about environmental conditions affecting wildfire behavior, such as wind speed and direction.

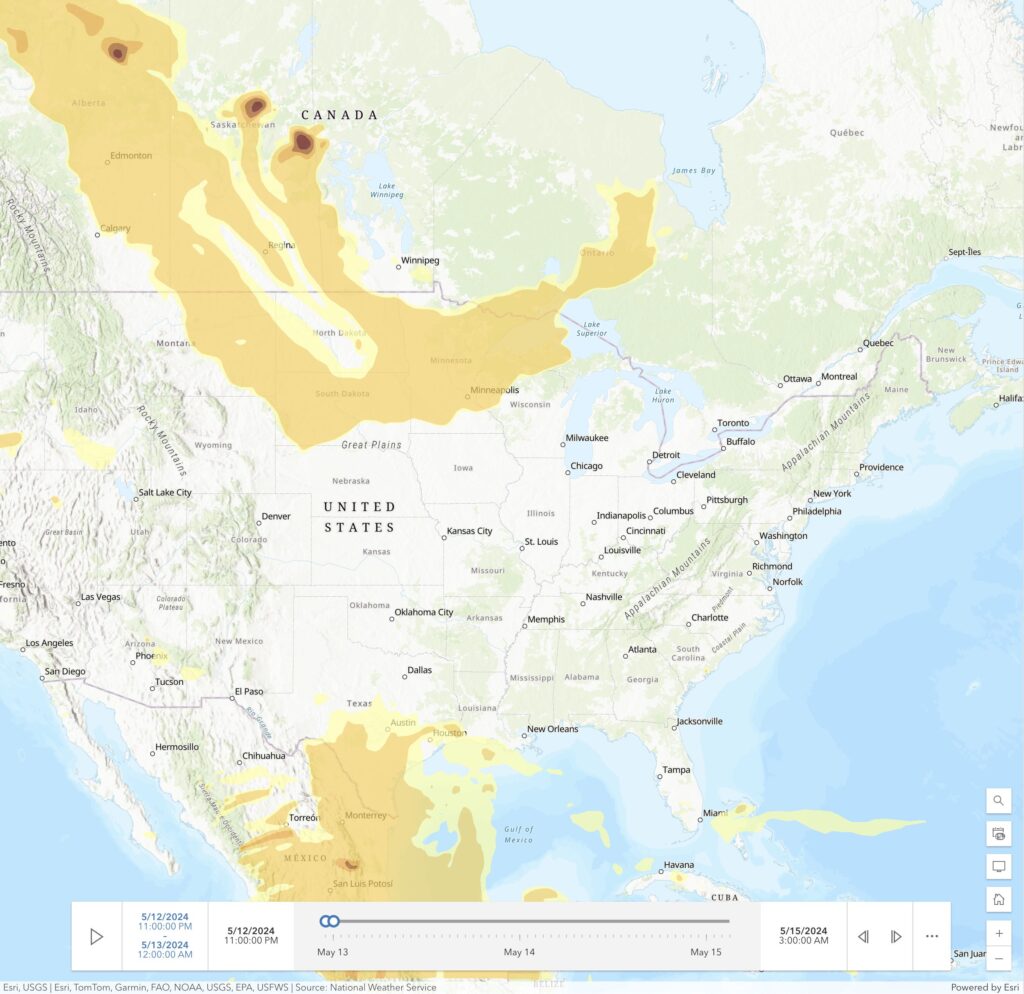
National Weather Service (NWS) Smoke Forecast
The National Weather Service (NWS) Smoke Forecast is an invaluable resource for individuals and communities impacted by wildfires, providing crucial information to help mitigate the health risks associated with smoke exposure. Leveraging advanced modeling techniques and real-time data, the NWS Smoke Forecast offers forecasts and projections regarding the movement and dispersion of smoke particles in affected areas.

By accessing the NWS Smoke Forecast, individuals can gain insights into the anticipated concentration levels of smoke particles over specified time periods and geographic regions.
This information allows users to make informed decisions regarding outdoor activities, ventilation practices, and protective measures to safeguard their health and well-being.
Confidence and Security
As wildfire threats become increasingly prevalent, leveraging advanced monitoring tools is crucial for effective risk management and protection. These tools not only provide vital real-time data but also help in crafting anticipatory response plans that enable informed decision-making and proactive measures.
One group that is experimenting with solutions is The Copernicus Project, they are in the process of producing the climateSafe prototype. When fully realized the solution will combine IoT, GIS data harvesting and live monitoring in a simple smart app that can reside on home networks and smart phones. Not only will the device live monitor conditions it will also provide geo-located advice and action for the building owner to reduce risk from future climate events. This is coupled with feeds to locally available grants and funding to offset cost of the recommendations. The solution will leverage existing virtual assistant platforms like Alexa, Amazon Alexa, Google Assistant, Apple Siri, Microsoft Cortana, and Samsung Bixby.
For enterprise and business applications, IBM Watson provides advanced natural language processing and AI capabilities that can be integrated into climateSafe.
Fostering resilience and preparedness
Integrating these technologies into daily practices enables individuals and communities to enhance their health protection, optimize safety, and sustain well-being in changing environmental conditions. Embracing such strategies fosters resilience and preparedness, allowing them to tackle environmental threats with increased confidence and security.